
66 companies are highlighted in this week’s preview (October 19–23, 2026). The biggest expected move belongs to BBD at ±14.9%. The expected move is the options market’s estimate of the post-earnings swing — read from the implied move in option prices. It is a size, not a direction. Many more names report each day inside the app.
By sector this week: Industrials (16), Financial Services (11), Consumer Cyclical (7), Communication Services (6), Healthcare (6), Technology (5), Basic Materials (4), Energy (4), Consumer Defensive (3), Real Estate (1), Utilities (1). Each company in the table below carries its sector tag.
Most anticipated earnings this week
The largest companies reporting October 19–23, 2026, ranked by market cap, each with the move the options market is pricing in. These are the reports that set the tone for the week; the full preview table and day filters follow below.
- META Meta Platforms — Wednesday, after close · expected move ±6.9% · $1500B
- TSLA Tesla — Wednesday, after close · expected move ±7.0% · $1270B
- GE General Electric — Tuesday, before open · expected move ±6.6% · $396B
- LRCX Lam Research — Wednesday, after close · expected move ±8.0% · $385B
- PG Procter and Gamble — Thursday, before open · expected move ±3.2% · $336B
- NFLX Netflix — Tuesday, after close · expected move ±9.9% · $309B
- RTX Raytheon Technologies — Tuesday, before open · expected move ±5.2% · $300B
- PM Philip Morris International — Wednesday, before open · expected move ±4.3% · $294B
- TXN Texas Instruments Incorporated — Wednesday, after close · expected move ±7.5% · $254B
- AXP American Express — Friday, before open · expected move ±5.3% · $236B
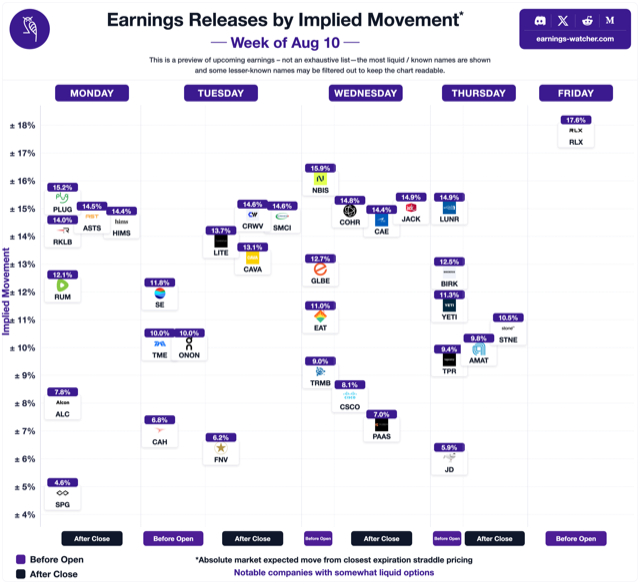
Earnings releases by implied move (preview)
Each box is a highlighted company reporting October 19–23, 2026, placed by the options-implied move. This chart shows our weekly preview subset only — not every ticker on the platform calendar.
This week’s preview: earnings & expected moves
Curated liquid names for October 19–23, 2026. Filter by day below. For the complete list, filters and live updates, open EarningsWatcher.
| Stock | Day | Report | Expected move | Avg move | Last report |
|---|---|---|---|---|---|
| AGNC AGNC Investment Real Estate | Mon | After close | ±3.8% | ±2.8% | +2.2% |
| FITB Fifth Third Financial Services | Mon | Before open | ±6.3% | ±3.8% | −7.4% |
| ZION Zions Financial Services | Mon | After close | ±7.8% | ±5.2% | −5.8% |
| CLF Cleveland Cliffs Basic Materials | Mon | Before open | ±7.8% | ±11.8% | +21.3% |
| WAL Western Alliance Financial Services | Mon | After close | ±9.7% | ±6.2% | +4.3% |
| STLD Steel Dynamics Basic Materials | Mon | After close | ±11.5% | ±5.3% | +4.1% |
| COF Capital One Financial Services | Tue | After close | ±5.1% | ±5.5% | −3.6% |
| RTX Raytheon Technologies Industrials | Tue | Before open | ±5.2% | ±6.2% | +9.5% |
| CB DBA Chubb Limited Financial Services | Tue | After close | ±5.3% | ±3.8% | −4.7% |
| MMM 3M Industrials | Tue | Before open | ±5.8% | ±6.2% | +10.7% |
| UAL United Airlines Industrials | Tue | After close | ±6.3% | ±7.3% | −4.1% |
| GE General Electric Industrials | Tue | Before open | ±6.6% | ±7.0% | −6.6% |
| AMX AMX Communication Services | Tue | After close | ±7.4% | ±4.0% | +1.8% |
| HAL Halliburton Energy | Tue | Before open | ±7.7% | ±4.6% | −7.8% |
| NOC Northrop Grumman Corp Holding Industrials | Tue | Before open | ±7.7% | ±5.0% | −8.6% |
| ISRG Intuitive Surgical Healthcare | Tue | After close | ±8.1% | ±7.1% | −14.4% |
| HAS Hasbro Consumer Cyclical | Tue | Before open | ±8.4% | ±9.5% | +14.0% |
| GM General Motors Consumer Cyclical | Tue | Before open | ±9.5% | ±6.2% | +5.7% |
| NFLX ★ Netflix Communication Services | Tue | After close | ±9.9% | ±10.2% | −12.5% |
| EFX Equifax Industrials | Tue | Before open | ±12.4% | ±7.2% | −13.9% |
| ALK Alaska Air Group Industrials | Tue | After close | ±13.1% | ±5.6% | −8.8% |
| TMO Thermo Fisher Scientific Healthcare | Wed | Before open | ±0.0% | ±5.2% | +11.6% |
| KMI Kinder Morgan Energy | Wed | After close | ±3.0% | ±3.4% | +2.4% |
| NEE NextEra Energy Utilities | Wed | Before open | ±3.6% | ±3.6% | −1.5% |
| CME CME Group Financial Services | Wed | Before open | ±3.6% | ±3.5% | +7.5% |
| PM Philip Morris International Consumer Defensive | Wed | Before open | ±4.3% | ±5.3% | +6.2% |
| T AT&T Communication Services | Wed | Before open | ±4.5% | ±5.3% | +6.2% |
| CSX CSX Industrials | Wed | After close | ±4.7% | ±5.1% | +6.8% |
| ABT Abbott Laboratories Healthcare | Wed | Before open | ±5.6% | ±4.8% | +14.1% |
| LUV Southwest Airlines Industrials | Wed | After close | ±5.9% | ±6.7% | −6.8% |
| LVS Las Vegas Sands Consumer Cyclical | Wed | After close | ±6.0% | ±6.2% | +3.3% |
| DHR Danaher Healthcare | Wed | Before open | ±6.5% | ±5.4% | −17.6% |
| SAP SAP SE Technology | Wed | After close | ±6.7% | ±5.1% | +10.2% |
| META ★ Meta Platforms Communication Services | Wed | After close | ±6.9% | ±10.4% | −10.4% |
| TSLA ★ Tesla Consumer Cyclical | Wed | After close | ±7.0% | ±9.6% | −15.6% |
| IBM International Business Machines Technology | Wed | After close | ±7.1% | ±7.1% | −3.2% |
| MCO Moodys Financial Services | Wed | Before open | ±7.1% | ±4.3% | −1.6% |
| TXN Texas Instruments Incorporated Technology | Wed | After close | ±7.5% | ±6.1% | −6.8% |
| LRCX Lam Research Technology | Wed | After close | ±8.0% | ±7.1% | +26.6% |
| URI United Rentals Industrials | Wed | After close | ±8.0% | ±8.0% | +13.8% |
| ELV ELV Healthcare | Wed | Before open | ±9.0% | ±6.3% | −11.9% |
| MOH Molina Healthcare Healthcare | Wed | After close | ±13.9% | ±10.2% | −13.3% |
| PG Procter and Gamble Consumer Defensive | Thu | Before open | ±3.2% | ±3.9% | −5.8% |
| UNP Union Pacific Industrials | Thu | Before open | ±4.1% | ±5.0% | +8.0% |
| NDAQ Nasdaq Financial Services | Thu | Before open | ±4.4% | ±3.8% | +2.9% |
| LMT Lockheed Martin Industrials | Thu | Before open | ±4.7% | ±4.8% | +12.0% |
| DOW Dow Basic Materials | Thu | Before open | ±5.2% | ±5.7% | +4.7% |
| HON Honeywell International Industrials | Thu | Before open | ±5.2% | ±4.2% | +7.4% |
| PHM PulteGroup Consumer Cyclical | Thu | Before open | ±5.3% | ±6.0% | +3.9% |
| NEM Newmont Basic Materials | Thu | After close | ±5.5% | ±5.7% | −2.3% |
| VLO Valero Energy Energy | Thu | Before open | ±5.6% | ±4.6% | +4.1% |
| NSC Norfolk Southern Industrials | Thu | Before open | ±5.6% | ±4.5% | +8.4% |
| BX Blackstone Group Financial Services | Thu | Before open | ±5.7% | ±4.7% | +3.0% |
| CMCSA Comcast Communication Services | Thu | Before open | ±6.5% | ±6.1% | −6.8% |
| AAL American Airlines Group Industrials | Thu | Before open | ±7.5% | ±7.2% | −10.0% |
| BCS BCS Financial Services | Thu | Before open | ±8.5% | ±3.0% | −8.4% |
| SPOT Spotify Technology SA Communication Services | Thu | Before open | ±9.2% | ±11.7% | −5.0% |
| WDC Western Digital Technology | Thu | After close | ±9.7% | ±9.4% | −21.5% |
| DECK Deckers Outdoor Consumer Cyclical | Thu | After close | ±9.9% | ±11.3% | −4.6% |
| ARGX argenx SE, a biotechnology company, engages in the developing of various therapies for the treatment of autoimmune diseases in the United States, the Netherlands, Belgium, Japan, Switzerland, Germany, France, Canada, the United Kingdom, and Italy | Thu | Before open | ±10.7% | ±3.9% | +4.1% |
| BE Bloom Energy Industrials | Thu | After close | ±11.4% | ±16.5% | +11.3% |
| SAM Boston Beer Company Consumer Defensive | Thu | After close | ±12.5% | ±11.0% | +4.2% |
| BBD BBD | Thu | After close | ±14.9% | ±4.4% | −2.0% |
| AXP American Express Financial Services | Fri | Before open | ±5.3% | ±5.0% | −6.6% |
| SLB Schlumberger Energy | Fri | Before open | ±6.2% | ±4.8% | +11.4% |
| ALV Autoliv Consumer Cyclical | Fri | Before open | ±8.2% | ±6.7% | −6.6% |
No companies from this week’s preview report on . Try another day, or join EarningsWatcher for the full calendar.
How to read it. “Expected move” is the options-implied move for the upcoming report. “Avg move” is the stock’s typical earnings-day move historically. “Last report” is the most recent earnings move. “Before open” / “after close” is when the company reports.
182 more reporters this week, on the platform
The free preview above is 66 curated names. Members see every company on the week’s calendar (248 this week) with live implied moves, IV rush and crush, beat rates and full move history.
| Stock | Day | Report | Expected move |
|---|---|---|---|
| NOK | Thu | Before open | — |
| INFY | Fri | Before open | ±10.7% |
| WAB | Wed | Before open | ±7.2% |
| CBRE | Thu | Before open | ±9.6% |
| MSCI | Tue | Before open | ±8.1% |
| WCN | Wed | After close | ±5.7% |
What the expected move tells you
A larger expected move means options are pricing in a bigger swing — and charging more premium for it. Whether that premium has historically been rich or cheap depends on how often the stock actually beats its implied move; our data study on which stocks beat the implied move shows how widely that varies. Going into any report, implied volatility builds (the IV rush) and then collapses afterward (the IV crush). This page is information to research from, not a recommendation.
Frequently asked questions
What are the most anticipated earnings this week and next week?
The most anticipated reports are the largest companies by market cap reporting in the window — the names that move sector ETFs and set the tone for everything that follows. They are listed in rank order at the top of this page, each with its report day, session and the options-implied expected move; the next-week page carries the same ranking for the following Monday-to-Friday window.
Who reports earnings next week?
The next-week calendar lists every liquid company scheduled to report in the following Monday-to-Friday window, with the options-implied expected move for each. Dates are added as companies confirm them, so the list fills in through the week; the current week's calendar is the complete public preview.
What is an expected (implied) move on earnings?
The expected move is how big a price swing the options market is pricing in for an upcoming earnings report. It is read from option prices — roughly the cost of the at-the-money straddle for the expiry covering the report — and represents the market's one-standard-deviation estimate of the post-earnings move. It is a magnitude, not a direction.
How do I read this week's earnings table?
“Expected move” is the options-implied move for the upcoming report. “Avg move” is the stock's typical earnings-day move historically. “Last report” is the most recent earnings move (signed). “Before open” means the company reports before the market opens; “after close” means after it closes.
Does a bigger expected move mean a stock is a better trade?
No. A larger expected move simply means options are pricing in a larger swing — and charging more premium for it. Whether that premium is rich or cheap depends on how the stock has actually moved versus its implied move in the past. This page is information, not advice.
What are the biggest names reporting this week?
For the week of October 19–23, 2026, the preview highlights Tesla (Wednesday after the close), Meta Platforms (Wednesday after the close), Netflix (Tuesday after the close) and General Electric (Tuesday before the open). See the chart and day filters above for the full curated list, and the platform for every reporting stock.
Is this the full earnings calendar?
No. This page is a free weekly preview of the most liquid, widely watched names — a curated subset, not every company reporting. The EarningsWatcher platform has the complete calendar, live implied moves that update into each report, full move history, IV rush/crush metrics and more. Join at earnings-watcher.com to see every name.