
153 companies are highlighted in this week’s preview (November 2–6, 2026). The biggest expected move belongs to Hertz Global at ±21.8%. The expected move is the options market’s estimate of the post-earnings swing — read from the implied move in option prices. It is a size, not a direction. Many more names report each day inside the app.
By sector this week: Technology (40), Healthcare (17), Consumer Cyclical (14), Energy (13), Financial Services (13), Industrials (12), Consumer Defensive (10), Utilities (6), Communication Services (6), Real Estate (4), Basic Materials (4). Each company in the table below carries its sector tag.
Most anticipated earnings this week
The largest companies reporting November 2–6, 2026, ranked by market cap, each with the move the options market is pricing in. These are the reports that set the tone for the week; the full preview table and day filters follow below.
- AAPL Apple — Monday, after close · expected move ±4.2% · $4539B
- AMD Advanced Micro Devices — Tuesday, after close · expected move ±8.8% · $776B
- PLTR Palantir Technologies — Monday, after close · expected move ±12.4% · $380B
- ARM Arm — Wednesday, after close · expected move ±15.1% · $293B
- ANET Arista Networks — Tuesday, after close · expected move ±10.9% · $248B
- AMGN Amgen — Tuesday, after close · expected move ±5.3% · $220B
- NVO Novo Nordisk — Wednesday, before open · expected move ±7.0% · $197B
- MCD McDonalds — Wednesday, before open · expected move ±4.0% · $191B
- SHOP Shopify — Tuesday, before open · expected move ±13.6% · $187B
- ETN Eaton Corp New — Tuesday, before open · expected move ±8.0% · $173B
Earnings releases by implied move (preview)
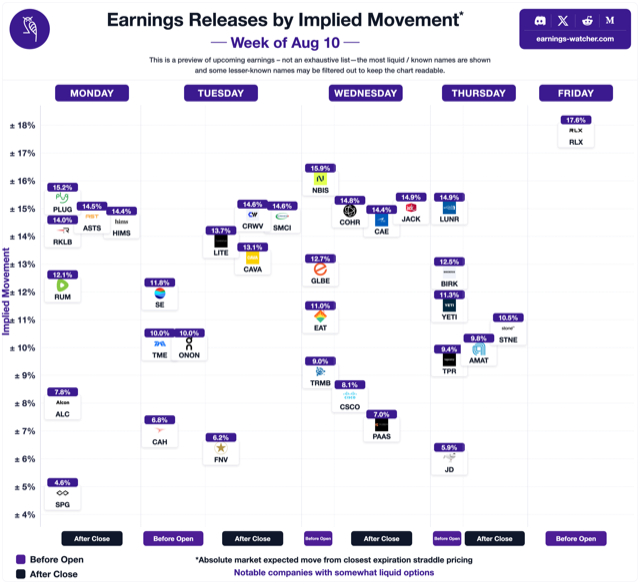
Each box is a highlighted company reporting November 2–6, 2026, placed by the options-implied move. This chart shows our weekly preview subset only — not every ticker on the platform calendar.
This week’s preview: earnings & expected moves
Curated liquid names for November 2–6, 2026. Filter by day below. For the complete list, filters and live updates, open EarningsWatcher.
| Stock | Day | Report | Expected move | Avg move | Last report |
|---|---|---|---|---|---|
| O Realty Income Real Estate | Mon | After close | ±3.7% | ±2.6% | +3.6% |
| AAPL ★ Apple Technology | Mon | After close | ±4.2% | ±5.0% | −10.0% |
| MAR Marriott International Consumer Cyclical | Mon | Before open | ±4.6% | ±4.5% | −7.7% |
| PEG Public Service Enterprise Group Utilities | Mon | Before open | ±5.0% | ±2.9% | −3.2% |
| WMB Williams Companies Energy | Mon | After close | ±5.0% | ±3.8% | +3.0% |
| VRTX Vertex Pharmaceuticals Healthcare | Mon | After close | ±5.9% | ±5.1% | +3.7% |
| FANG Diamondback Energy Energy | Mon | After close | ±7.7% | ±5.0% | −5.3% |
| CLX Clorox Consumer Defensive | Mon | After close | ±8.1% | ±6.4% | +6.7% |
| IDXX IDEXX Laboratories Healthcare | Mon | Before open | ±9.3% | ±8.2% | +9.9% |
| EL Estee Lauder Companies Consumer Defensive | Mon | Before open | ±9.4% | ±10.0% | +18.4% |
| ON ON Semiconductor Technology | Mon | After close | ±10.5% | ±9.2% | +5.1% |
| PLTR ★ Palantir Technologies Technology | Mon | After close | ±12.4% | ±17.0% | +30.9% |
| FN Fabrinet Technology | Mon | After close | ±21.4% | ±13.0% | −21.8% |
| ET Energy Transfer LP Energy | Tue | Before open | ±4.0% | ±3.6% | +2.0% |
| MPLX MPLX LP Energy | Tue | Before open | ±4.2% | ±3.4% | +3.0% |
| AIG American International Group Financial Services | Tue | After close | ±4.7% | ±5.3% | −2.6% |
| SU Suncor Energy Energy | Tue | After close | ±4.8% | ±4.1% | −2.8% |
| PFE Pfizer Healthcare | Tue | Before open | ±5.0% | ±3.6% | +2.4% |
| AMGN Amgen Healthcare | Tue | After close | ±5.3% | ±5.3% | +6.7% |
| SYY Sysco Consumer Defensive | Tue | Before open | ±5.5% | ±5.3% | −5.4% |
| KDP Keurig Dr Pepper Consumer Defensive | Tue | Before open | ±6.0% | ±5.2% | +7.8% |
| RACE Ferrari Consumer Cyclical | Tue | Before open | ±6.2% | ±6.0% | +4.5% |
| AME Ametek Industrials | Tue | Before open | ±6.5% | ±2.2% | +5.6% |
| PRU Prudential Financial Services | Tue | After close | ±6.7% | ±4.6% | −4.8% |
| APO Apollo Global Management Financial Services | Tue | Before open | ±6.8% | ±5.5% | +3.3% |
| JKHY Jack Henry and Associates Technology | Tue | After close | ±7.1% | ±5.9% | +10.6% |
| ADM Archer Daniels Midland Consumer Defensive | Tue | Before open | ±7.3% | ±4.8% | +2.8% |
| DD DuPont de Nemours | Tue | Before open | ±7.3% | ±5.9% | −7.8% |
| BKNG Booking Consumer Cyclical | Tue | After close | ±7.5% | ±6.6% | +8.9% |
| ETN Eaton Corp New Industrials | Tue | Before open | ±8.0% | ±4.8% | +8.6% |
| WAT Waters Healthcare | Tue | Before open | ±8.1% | ±7.1% | +7.3% |
| AMD ★ Advanced Micro Devices Technology | Tue | After close | ±8.8% | ±10.6% | −7.8% |
| ITUB ITUB Financial Services | Tue | After close | ±9.7% | ±4.2% | +1.5% |
| TRI Thomson Reuters Industrials | Tue | Before open | ±10.4% | ±5.2% | −10.4% |
| XYZ Block | Tue | After close | ±10.5% | ±11.5% | −6.8% |
| ANET Arista Networks Technology | Tue | After close | ±10.9% | ±12.0% | +12.8% |
| MPC Marathon Petroleum Energy | Tue | Before open | ±10.9% | ±5.2% | +2.6% |
| DT Dynatrace Technology | Tue | Before open | ±11.5% | ±11.3% | +16.6% |
| IT Gartner Technology | Tue | Before open | ±12.1% | ±7.6% | +26.6% |
| UPST Upstart Financial Services | Tue | Before open | ±13.1% | ±31.7% | +14.4% |
| SHOP ★ Shopify Technology | Tue | Before open | ±13.6% | ±13.6% | +24.8% |
| DUOL Duolingo, | Tue | After close | ±14.0% | ±18.8% | −17.2% |
| SMCI Super Micro Computer Technology | Tue | After close | ±14.4% | ±16.0% | +20.7% |
| ALAB Astera Labs | Tue | After close | ±15.9% | ±17.5% | −12.9% |
| MCD ★ McDonalds Consumer Cyclical | Wed | Before open | ±4.0% | ±3.4% | +2.4% |
| AFL AFLAC Financial Services | Wed | After close | ±4.0% | ±4.0% | −3.0% |
| RPRX Royalty Pharma Healthcare | Wed | Before open | ±5.3% | ±4.2% | +3.7% |
| KHC KHC Consumer Defensive | Wed | Before open | ±5.4% | ±6.1% | −4.9% |
| NTR Nutrien Basic Materials | Wed | After close | ±5.6% | ±5.2% | −4.6% |
| MFC Manulife Financial Services | Wed | After close | ±5.6% | ±4.4% | +2.0% |
| SLF Sun Life Financial Services | Wed | After close | ±5.7% | ±4.1% | −2.7% |
| GWW WW Grainger Industrials | Wed | Before open | ±5.8% | ±7.4% | −8.1% |
| MET MetLife Financial Services | Wed | After close | ±6.1% | ±4.4% | +4.9% |
| EMR Emerson Electric Industrials | Wed | Before open | ±6.3% | ±5.3% | +3.8% |
| ALL Allstate Financial Services | Wed | After close | ±6.5% | ±4.3% | +4.1% |
| MSI Motorola Solutions Technology | Wed | After close | ±6.9% | ±6.0% | +12.7% |
| NVO Novo Nordisk Healthcare | Wed | Before open | ±7.0% | ±5.2% | +6.0% |
| CVS CVS Health Healthcare | Wed | Before open | ±7.6% | ±6.6% | −10.5% |
| UBER ★ Uber Technologies Technology | Wed | Before open | ±7.7% | ±8.8% | −7.3% |
| MELI MercadoLibre Consumer Cyclical | Wed | After close | ±7.8% | ±11.5% | −8.1% |
| MCK McKesson Healthcare | Wed | After close | ±7.8% | ±6.5% | −4.2% |
| FIS Fidelity National Information Technology | Wed | Before open | ±7.9% | ±6.7% | −12.9% |
| TKO TKO Group | Wed | After close | ±7.9% | ±5.7% | +5.8% |
| PAAS Pan American Silver Basic Materials | Wed | After close | ±8.1% | ±7.4% | −10.4% |
| COR CoreSite Realty Healthcare | Wed | Before open | ±8.4% | ±3.9% | +6.8% |
| TRMB Trimble Technology | Wed | Before open | ±9.0% | ±7.3% | +6.9% |
| QCOM ★ QUALCOMM Technology | Wed | After close | ±10.6% | ±7.5% | −6.2% |
| EXPE Expedia Group Consumer Cyclical | Wed | After close | ±11.0% | ±11.3% | −4.3% |
| PAYC Paycom Software Technology | Wed | After close | ±12.0% | ±11.7% | +26.1% |
| CDW CDW Technology | Wed | Before open | ±12.6% | ±6.8% | −26.6% |
| RVMD Revolution Medicines Healthcare | Wed | After close | ±12.7% | ±8.4% | +2.9% |
| CAVA CAVA Group, | Wed | After close | ±12.8% | ±14.3% | +17.9% |
| ELF ELF Consumer Defensive | Wed | After close | ±12.8% | ±15.5% | +11.3% |
| W Wayfair Consumer Cyclical | Wed | Before open | ±13.1% | ±16.9% | +32.5% |
| CRCL Circle Technology | Wed | Before open | ±14.0% | ±18.3% | −6.5% |
| NICE NICE Technology | Wed | Before open | ±14.2% | ±7.8% | −9.5% |
| DDOG Datadog Technology | Wed | Before open | ±14.3% | ±15.2% | −20.5% |
| ZG Zillow Group Communication Services | Wed | After close | ±14.6% | ±13.4% | −17.1% |
| FLUT FLUT | Wed | Before open | ±14.7% | ±9.3% | −14.5% |
| ARM ★ Arm Technology | Wed | After close | ±15.1% | ±14.6% | +19.4% |
| GFS GFS Technology | Wed | Before open | ±15.3% | ±6.0% | −7.7% |
| Z Zillow Group Communication Services | Wed | After close | ±15.4% | ±13.4% | −17.3% |
| RIOT Riot Blockchain Financial Services | Wed | Before open | ±15.8% | ±11.9% | +10.6% |
| RUN Sunrun Technology | Wed | After close | ±15.8% | ±14.4% | −17.9% |
| COHR Coherent Technology | Wed | After close | ±16.0% | ±8.0% | −8.5% |
| SNAP Snap Communication Services | Wed | After close | ±16.0% | ±21.2% | +15.5% |
| COTY Coty Consumer Defensive | Wed | After close | ±16.6% | ±13.2% | −17.2% |
| SEDG SolarEdge Technologies Technology | Wed | Before open | ±16.9% | ±16.9% | −30.7% |
| APP AppLovin Technology | Wed | After close | ±17.0% | ±22.3% | −20.5% |
| HUBS HubSpot Technology | Wed | After close | ±17.1% | ±11.0% | −26.0% |
| WOLF WOLF Technology | Wed | After close | ±19.5% | ±20.4% | −17.0% |
| DUK Duke Energy Corp New Utilities | Thu | Before open | ±3.6% | ±2.5% | −2.0% |
| SO Southern Utilities | Thu | Before open | ±3.6% | ±2.5% | −2.4% |
| ED Consolidated Edison Utilities | Thu | After close | ±3.8% | ±2.4% | −2.2% |
| KMB Kimberly Clark Consumer Defensive | Thu | Before open | ±4.2% | ±4.5% | +4.2% |
| CNQ Canadian Natural Resources Energy | Thu | Before open | ±4.7% | ±3.7% | +2.9% |
| COP ConocoPhillips Energy | Thu | Before open | ±4.8% | ±3.6% | +4.4% |
| SPG Simon Property Group Real Estate | Thu | After close | ±4.8% | ±4.7% | +1.4% |
| EOG EOG Resources Energy | Thu | After close | ±5.1% | ±5.1% | −6.6% |
| TRP TC Energy Energy | Thu | Before open | ±5.1% | ±2.0% | +4.0% |
| SRE Sempra Energy Utilities | Thu | Before open | ±5.3% | ±1.9% | +1.5% |
| BCE BCE Communication Services | Thu | Before open | ±5.5% | ±1.7% | +4.4% |
| WEN Wendys Consumer Cyclical | Thu | Before open | ±5.5% | ±6.0% | +4.6% |
| IRM Iron Mountain Inc REIT Real Estate | Thu | Before open | ±5.7% | ±5.5% | −4.1% |
| DVN Devon Energy Energy | Thu | After close | ±5.9% | ±6.2% | −4.6% |
| CI Cigna Healthcare | Thu | Before open | ±6.2% | ±5.4% | −5.2% |
| CAH Cardinal Health Healthcare | Thu | Before open | ±6.2% | ±7.3% | +8.9% |
| BDX Becton Dickinson and Healthcare | Thu | Before open | ±7.0% | ±5.6% | +5.1% |
| TRGP Targa Resources Energy | Thu | Before open | ±7.1% | ±4.9% | +4.1% |
| WPM Wheaton Precious Metals Basic Materials | Thu | After close | ±7.2% | ±4.5% | +8.6% |
| SONY SONY Technology | Thu | Before open | ±7.3% | ±6.1% | +5.8% |
| ABNB ★ Airbnb Consumer Cyclical | Thu | After close | ±7.6% | ±9.6% | +17.7% |
| ONC ONC | Thu | Before open | ±8.1% | ±7.1% | +3.1% |
| PH Parker Hannifin Industrials | Thu | Before open | ±8.1% | ±5.5% | +10.3% |
| MNST Monster Beverage Consumer Defensive | Thu | After close | ±8.2% | ±7.7% | −4.9% |
| BILL Bill.com Technology | Thu | After close | ±8.5% | ±21.1% | +5.0% |
| CMI Cummins Industrials | Thu | Before open | ±9.2% | ±5.8% | −11.0% |
| ROK Rockwell Automation Industrials | Thu | Before open | ±9.8% | ±7.9% | −9.9% |
| TPR Tapestry Consumer Cyclical | Thu | Before open | ±10.0% | ±10.4% | −16.9% |
| ZTS Zoetis Healthcare | Thu | Before open | ±10.3% | ±6.6% | +7.0% |
| GPN Global Payments Industrials | Thu | Before open | ±10.6% | ±6.4% | +2.9% |
| MP MP Materials Basic Materials | Thu | After close | ±10.6% | ±9.3% | +12.6% |
| DKNG DraftKings Consumer Cyclical | Thu | After close | ±11.4% | ±10.9% | +8.9% |
| YELP Yelp Communication Services | Thu | After close | ±11.4% | ±12.6% | +16.7% |
| LYFT Lyft Technology | Thu | After close | ±11.9% | ±15.6% | +7.7% |
| AAP Advance Auto Parts Consumer Cyclical | Thu | Before open | ±12.1% | ±12.7% | −27.6% |
| AFRM Affirm Technology | Thu | After close | ±12.1% | ±20.4% | +16.7% |
| IONQ IonQ | Thu | After close | ±12.7% | ±17.0% | +4.9% |
| AKAM Akamai Technologies Technology | Thu | After close | ±12.9% | ±10.3% | −7.2% |
| NTRA Natera Healthcare | Thu | After close | ±13.2% | ±14.5% | +21.7% |
| U Unity Software Technology | Thu | Before open | ±13.2% | ±16.6% | +17.5% |
| LITE Lumentum Technology | Thu | After close | ±13.2% | ±11.3% | +17.8% |
| EPAM EPAM Systems Technology | Thu | Before open | ±13.5% | ±9.9% | −20.8% |
| AXON Axon Enterprise Industrials | Thu | After close | ±14.2% | ±16.2% | −15.3% |
| NET Cloudflare Technology | Thu | After close | ±14.3% | ±14.7% | +14.2% |
| SOUN SoundHound AI, | Thu | After close | ±15.2% | ±16.9% | +27.4% |
| TEAM Atlassian Corporation Technology | Thu | After close | ±15.3% | ±13.7% | +39.1% |
| PTON Peloton Interactive Consumer Cyclical | Thu | Before open | ±15.4% | ±20.2% | −16.6% |
| PZZA Papa Johns International | Thu | Before open | ±15.4% | ±8.4% | −18.4% |
| OPEN Opendoor Technologies Real Estate | Thu | After close | ±16.4% | ±20.6% | −9.7% |
| COMP Compass, | Thu | After close | ±18.3% | ±18.8% | +10.2% |
| IREN IREN Financial Services | Thu | After close | ±18.4% | ±20.6% | −14.1% |
| AAOI Applied Optoelectronics Technology | Thu | After close | ±20.4% | ±24.9% | +20.2% |
| HTZ Hertz Global Industrials | Thu | Before open | ±21.8% | ±16.3% | +40.4% |
| ENB Enbridge Energy | Fri | Before open | ±4.8% | ±2.6% | −1.9% |
| BAM Brookfield Asset Management Financial Services | Fri | Before open | ±6.1% | ±3.3% | +3.7% |
| VST Vistra Utilities | Fri | Before open | ±8.8% | ±5.3% | −4.7% |
| MRNA Moderna Healthcare | Fri | Before open | ±11.3% | ±10.8% | −5.5% |
| CHTR Charter Communications Inc New Communication Services | Fri | Before open | ±12.4% | ±8.9% | −11.8% |
| UAA Under Armour Consumer Cyclical | Fri | Before open | ±14.0% | ±13.9% | −10.9% |
| OKLO OKLO | Fri | Before open | ±14.1% | ±15.1% | +17.3% |
| FLR Fluor Industrials | Fri | Before open | ±14.6% | ±10.7% | +18.3% |
| WULF TeraWulf | Fri | Before open | ±16.3% | ±16.0% | −12.3% |
No companies from this week’s preview report on . Try another day, or join EarningsWatcher for the full calendar.
How to read it. “Expected move” is the options-implied move for the upcoming report. “Avg move” is the stock’s typical earnings-day move historically. “Last report” is the most recent earnings move. “Before open” / “after close” is when the company reports.
What the expected move tells you
A larger expected move means options are pricing in a bigger swing — and charging more premium for it. Whether that premium has historically been rich or cheap depends on how often the stock actually beats its implied move; our data study on which stocks beat the implied move shows how widely that varies. Going into any report, implied volatility builds (the IV rush) and then collapses afterward (the IV crush). This page is information to research from, not a recommendation.
Frequently asked questions
What are the most anticipated earnings this week and next week?
The most anticipated reports are the largest companies by market cap reporting in the window — the names that move sector ETFs and set the tone for everything that follows. They are listed in rank order at the top of this page, each with its report day, session and the options-implied expected move; the next-week page carries the same ranking for the following Monday-to-Friday window.
Who reports earnings next week?
The next-week calendar lists every liquid company scheduled to report in the following Monday-to-Friday window, with the options-implied expected move for each. Dates are added as companies confirm them, so the list fills in through the week; the current week's calendar is the complete public preview.
What is an expected (implied) move on earnings?
The expected move is how big a price swing the options market is pricing in for an upcoming earnings report. It is read from option prices — roughly the cost of the at-the-money straddle for the expiry covering the report — and represents the market's one-standard-deviation estimate of the post-earnings move. It is a magnitude, not a direction.
How do I read this week's earnings table?
“Expected move” is the options-implied move for the upcoming report. “Avg move” is the stock's typical earnings-day move historically. “Last report” is the most recent earnings move (signed). “Before open” means the company reports before the market opens; “after close” means after it closes.
Does a bigger expected move mean a stock is a better trade?
No. A larger expected move simply means options are pricing in a larger swing — and charging more premium for it. Whether that premium is rich or cheap depends on how the stock has actually moved versus its implied move in the past. This page is information, not advice.
What are the biggest names reporting this week?
For the week of November 2–6, 2026, the preview highlights Apple (Monday after the close), Advanced Micro Devices (Tuesday after the close), Uber Technologies (Wednesday before the open) and Shopify (Tuesday before the open). See the chart and day filters above for the full curated list, and the platform for every reporting stock.
Is this the full earnings calendar?
No. This page is a free weekly preview of the most liquid, widely watched names — a curated subset, not every company reporting. The EarningsWatcher platform has the complete calendar, live implied moves that update into each report, full move history, IV rush/crush metrics and more. Join at earnings-watcher.com to see every name.