
Manulife Financial Corporation (MFC) implied move — live earnings data
MFC options implied move for November 4, 2026 earnings (AMC): ±5.4%. As of November 4, 2026, the options market prices a ±5.4% earnings move for Manulife Financial Corporation (MFC)'s next report. The implied move — also called the expected move — is derived from live options prices. Below, each report's implied move is compared with what MFC actually did on earnings day.
Updated November 4, 2026 · refreshed daily from live options data · methodology
- MFC options imply a ±5.4% move for Manulife Financial Corporation's November 4, 2026 earnings report (after market close), as of November 4, 2026.
- Manulife Financial Corporation (MFC) has moved ±4.4% on average at the peak of earnings day over the last 10 years (40 reports).
- MFC's actual earnings move exceeded the options-implied move in 9 of its last 17 reports (53%).
- On its last report (August 5, 2026) MFC options had priced ±5.8% and the stock closed +0.3%.
- Simulator — likelihood of success and risk/reward for the exact straddle, strangle or spread you'd put on, against MFC's own 10-year reaction record
- IV Rush Radar — MFC's live IV curve vs its typical pre-earnings ramp, with the three snapshot signals and the projected straddle
- DriftLab — MFC's follow-through, gap-fill and drift scores for the days after the print
MFC implied vs actual earnings moves
Each report: what options priced in beforehand (purple) vs the actual peak intraday move (green when it beat implied, grey when it stayed inside).
MFC: recent reports
| Report | Options priced | Close-to-close | Peak intraday | vs implied |
|---|---|---|---|---|
| August 5, 2026 | ±5.8% | +0.3% | +2.0% | inside |
| May 13, 2026 | ±3.8% | -5.8% | -7.2% | beat |
| February 11, 2026 | ±3.9% | -5.5% | -6.1% | beat |
| November 12, 2025 | ±4.3% | +0.0% | +3.3% | inside |
| August 6, 2025 | ±4.3% | -3.8% | -4.3% | beat |
| May 7, 2025 | ±5.1% | -0.7% | -3.6% | inside |
Peak is the largest intraday move on the reaction day; "beat" means the peak move exceeded what options had priced in. The three most recent reports are free; members see the full history.
MFC beyond the implied move
The implied move is the size of the move. Three more readings for Manulife Financial Corporation, from the same pipeline — the free summary here, the full tools for members.
How MFC's earnings moves are distributed
| Percentile | 5th | 20th | Median | 80th | 95th |
|---|---|---|---|---|---|
| Move size | ±1.4% | ±2.5% | ±4.3% | ±5.2% | ±8.9% |
Recent regime: the 2-year average move (±5.1%) is hotter than the 10-year average (±4.4%).
What MFC does after the print
The implied move above is the size options price for the report. How the move unfolds afterwards is a separate question, and DriftLab tracks it for Manulife Financial Corporation across every past report: the follow-through score (does the earnings-day direction continue or reverse?), the gap-fill probability (how often the opening gap gets filled), the PEAD score (post-earnings drift strength), the reaction path of every release out to sixty sessions, and the current run drawn against the projected drift into the next report. One reading to set expectations: in 5 of Manulife Financial Corporation's last 15 reports the stock was further in the direction of its earnings-day close thirty sessions later. The full record, report by report, is on MFC stock after earnings. The scores themselves — the part that turns "it moved" into "will it keep going?" — are on the member DriftLab. Read what the metrics mean in the PEAD guide.
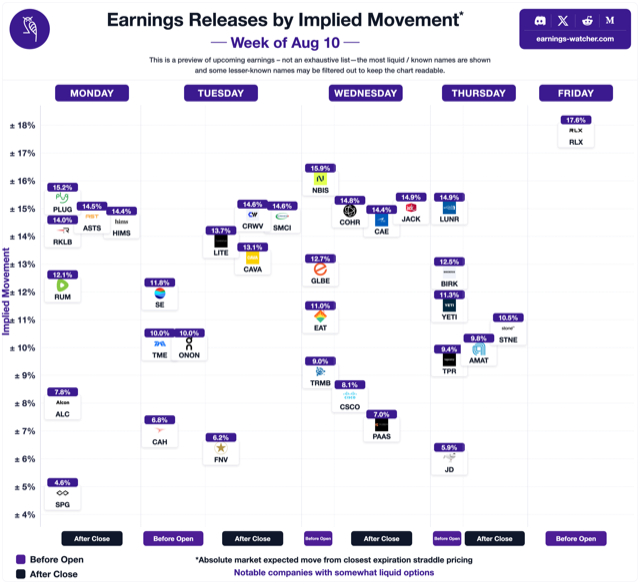
What is an implied move?
The implied move is the size of the earnings-day move the options market is pricing in, derived from the at-the-money straddle expiring just after the report. It is a market price, not a forecast. Learn more: how to calculate the implied move, or try the expected move calculator. After the report, options typically reprice sharply — the IV crush calculator shows what an option is worth once implied volatility resets.
Everything on this page is free and refreshes daily. Members get the tools that turn it into a decision.
For MFC and every stock on the calendar: beat probability against today's implied move, an IV-crush forecast for the morning after, a straddle simulator for this exact report, and the live IV-rush radar — the same data pipeline behind this page, pointed at your trades.