Free Implied Move API & Embeddable Widget
The open data behind the EarningsWatcher wiki — live options-implied earnings moves, 10-year average moves and implied-vs-actual history — as clean JSON and as a drop-in card for your site or newsletter. No API key, CORS enabled, refreshed daily. All we ask: credit EarningsWatcher with a link when you publish from it.
Quick start
No key, no sign-up, no rate limit to negotiate. Two requests get you everything:
# every covered symbol
curl https://earnings-watcher.com/api/implied/index.json

# one symbol
curl https://earnings-watcher.com/api/implied/NVDA.json
In the browser — CORS is open, so this works from any origin with no proxy:
const r = await fetch('https://earnings-watcher.com/api/implied/NVDA.json');
const d = await r.json();
console.log(d.implied_live_pct, d.average_move_pct, d.next_date);
Coverage: 154 symbols at the time of writing — the large and mid-cap names with liquid options that we track through each earnings season. index.json is the authoritative list; it changes as the calendar does. Responses carry cache-control: max-age=900, so a poll every fifteen minutes is the most that will ever return something new.
The JSON API
One file per symbol, plus an index of everything covered:
GET https://earnings-watcher.com/api/implied/index.json
GET https://earnings-watcher.com/api/implied/NVDA.json| Field | Meaning |
|---|---|
implied_live_pct | Options-implied move for the next confirmed earnings report (present only while one is upcoming) |
next_date, session | Next confirmed earnings date and session (BMO / AMC) |
average_move_pct, std_move_pct, sample_size | Average absolute earnings move over the last 10 years, its dispersion, and the number of reports behind it |
quantiles_pct | The move distribution (5th / 20th / 50th / 80th / 95th percentiles) |
implied_history | Per-report history: what options implied vs the peak and close move that printed |
as_of, cite_as, url | Data date, the requested attribution, and the source page to link |
This feed carries the published wiki data. Members also get DriftLab reaction scores, IV Rush signals, the scanner and the simulator — they live in the member platform and its MCP server.
Reading the payload
A symbol file is a single flat object. The fields that matter most:
implied_live_pct— the options-implied move for the next confirmed report. Present only while a report is still ahead. Once a company reports, the figure is frozen intoimplied_historyand this key disappears until the next confirmed date. Code against its absence.average_move_pct,std_move_pct,sample_size— the ten-year average absolute earnings move, its dispersion, and how many reports sit behind it. A smallsample_sizeis a newly listed company, not a data error.quantiles_pct— the 5th / 20th / 50th / 80th / 95th percentiles of that history, which is usually more useful than the average alone.implied_history— per report: the implied move recorded beforehand, and the peak and closing move that printed.as_of,cite_as,url— the data date, the attribution line we ask you to use, and the page to link.
Every number here is derived from real option prices and real closes; none of it is modelled or smoothed. Our methodology page defines each measure precisely, including why we use the peak move as the default.
This feed carries the published wiki data. Members also get DriftLab reaction scores, IV Rush signals, the scanner and the simulator — those live in the member platform and its MCP server.
The embeddable widget
Two lines. The card shows the live implied move when a report is coming, otherwise the 10-year distribution, and always links the source:
<div data-ew-implied="NVDA"></div>
<script async src="https://earnings-watcher.com/embed/implied-move.js"></script>
Live example:
Use any covered ticker (see the index). Multiple cards on one page work — one script tag is enough. The widget adapts to dark mode.
What people build with it
- A newsletter table. Pull
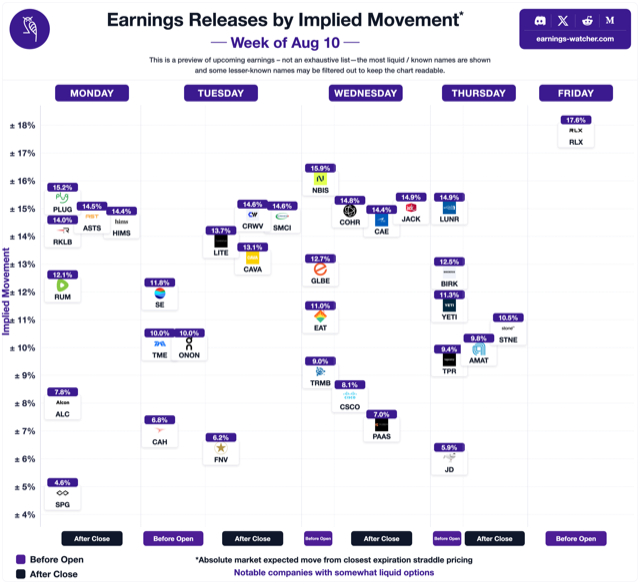
implied_live_pctfor the names reporting this week and publish the row before the print. This is what our own weekly card does. - A "is this move big?" annotation. Compare a live quote against
quantiles_pctto say whether today's reaction sits in the top fifth of that stock's last decade — the sort of context a raw percentage never gives. - A backtest input.
implied_historycarries what options implied versus what actually printed, per report, so you can measure whether a name has tended to exceed or fall short of its priced move. - A widget on a blog. If you do not want to touch JSON at all, the embeddable card below renders the same data in two lines.
Terms, in plain words
- Free for articles, newsletters, blogs, research and apps — commercial or not.
- Keep the attribution: the widget's built-in link, or for API data a mention of EarningsWatcher linking the
urlfield. - No sub-licensing the raw feed as your own API, and no scraping beyond the published files.
- Educational data, not investment advice; options are risky.
Questions or higher-volume needs: support@earnings-watcher.com.