
An IV crush calculator shows what happens to an option when implied volatility collapses after an earnings report. This one prices the contract with Black–Scholes on both sides of the print: once before, at the elevated pre-earnings IV, and once after — with the crushed IV, one day less of time value, and whatever move you expect the stock to make. That is the honest version of the question, because crush and direction land at the same moment and pull against each other.
Price the crush
Black–Scholes on both sides of the print: the option is repriced with the post-earnings IV, one day less of time value, and the stock move you enter. Your inputs only — no live EarningsWatcher data.
Scenarios you choose, not measurements. How far IV actually falls depends on the name, which expiry you are in, and how much of the move was already priced — that part is modelled per ticker on live option chains inside the platform.
| Stock move | Option value | P&L |
|---|
How to read the estimate
- The headline number is the change in the option’s value across the print.
- The table reprices the same contract across a range of moves, so you can see where crush stops winning — and the break-even line tells you the move needed just to stand still.
- What it leaves out: skew and term structure (one IV per side), bid/ask spreads, dividends, and early exercise. Directionally right, not a market maker’s book.
- Pair with: the expected move calculator (what is priced in) and IV crush after earnings.
Common mistakes
- Assuming the stock “going up” saves a long call from crush.
- Using far-dated IV that barely includes the event.
- Treating one famous quarter (e.g. NVDA May 2023) as the base case — case study.
How EarningsWatcher models the real crush
This calculator teaches the mechanics with one IV number. The real crush is not one number — it is different for every strike and every expiration, and getting it wrong is how a "conservative" earnings trade loses money on a quiet print.
The classic rule of thumb: after the report, the front expiry's IV collapses toward where the next expiration out already trades — or a further one for names with only monthly options — because that part of the curve carries no event premium. That rule is a decent anchor, and it is where our model starts, not where it ends.
EarningsWatcher runs a custom pipeline that fits the crush on what actually happened: for every name we measure how each strike and expiration repriced after its past reports, and fit the post-earnings IV to that history. So when the Simulator prices your position "the morning after", every leg carries its own fitted post-ER IV instead of one guessed number. A live example from the platform: ADBE reports September 10 — its at-the-money September-11 contracts trade at 61.4% IV, and the model prices them at 46.5% after the print. That gap is the whole P&L of holding through — you can see exactly that pair of numbers in the Simulator, right of the chain.
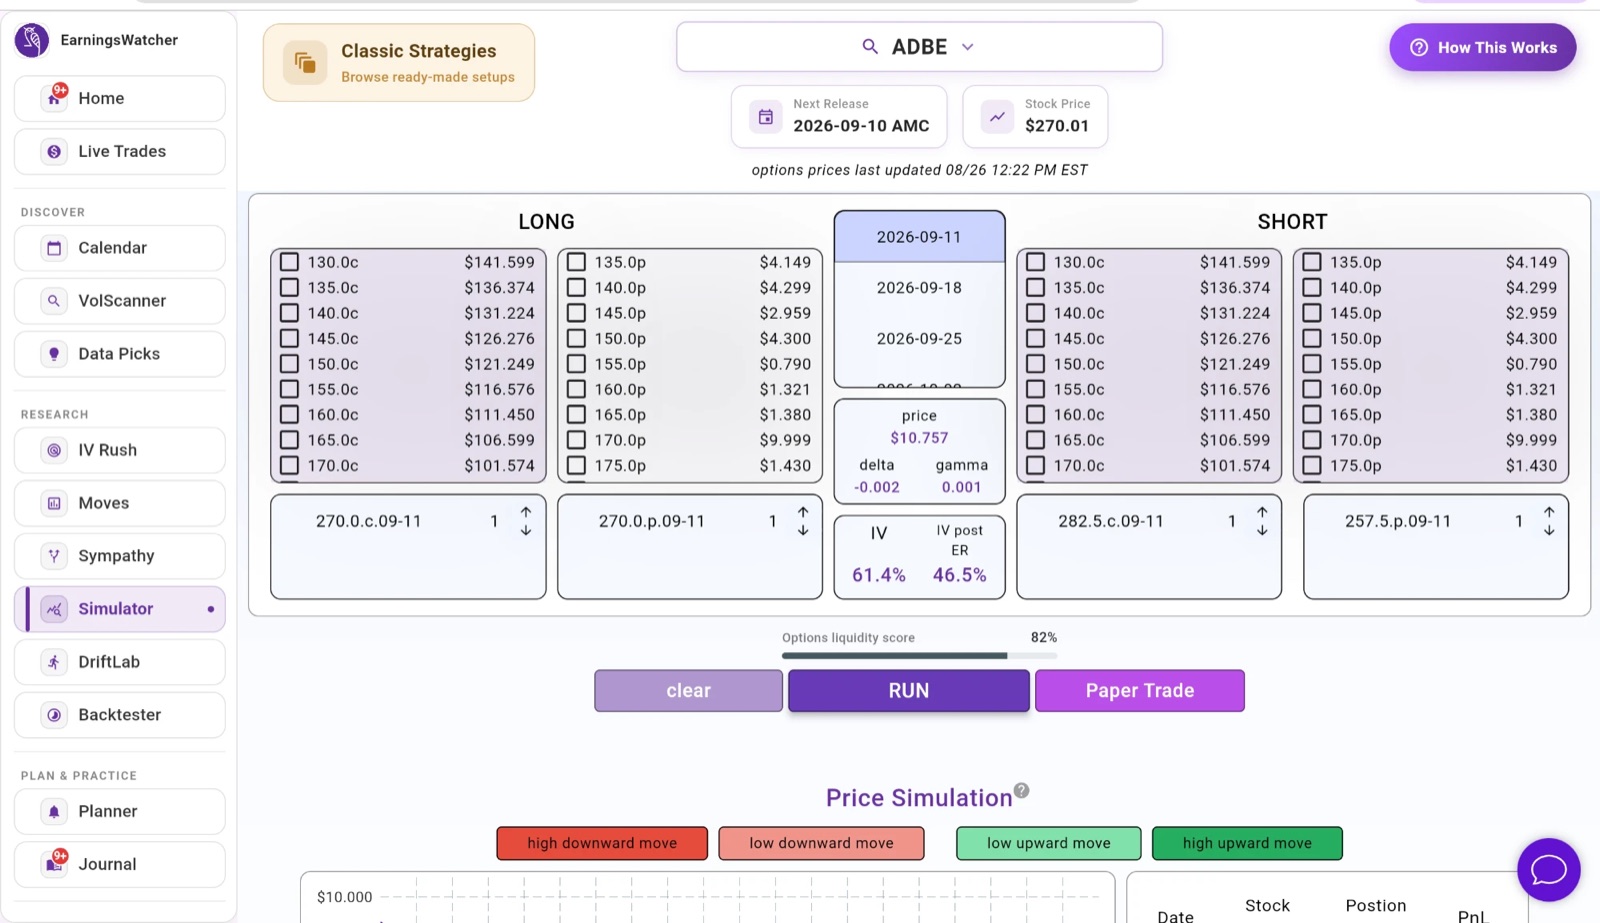
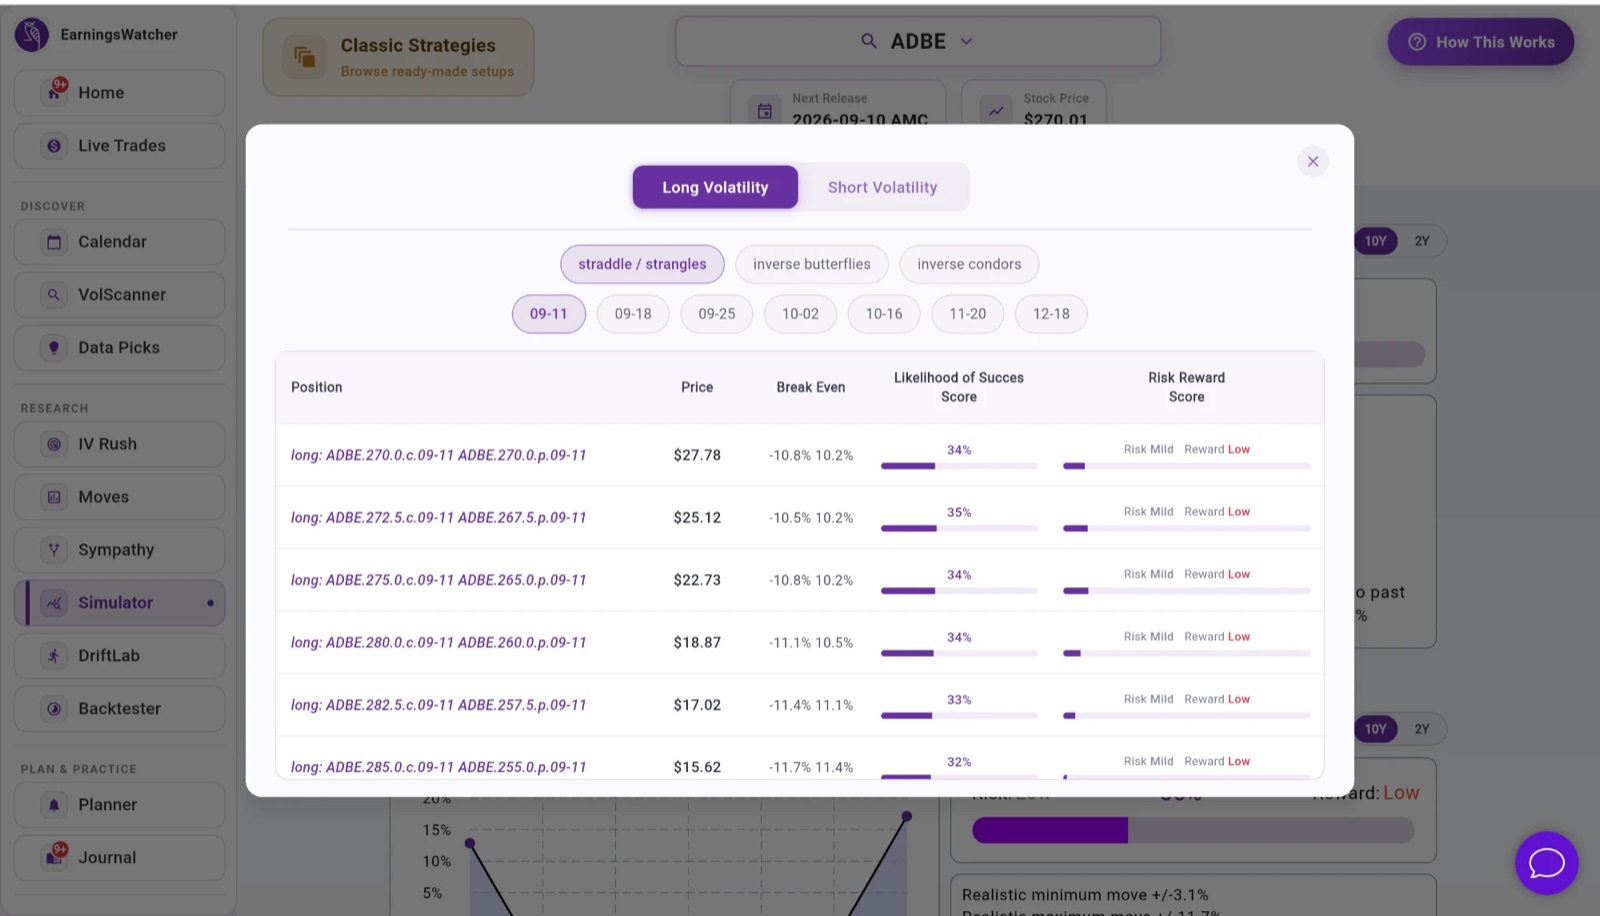
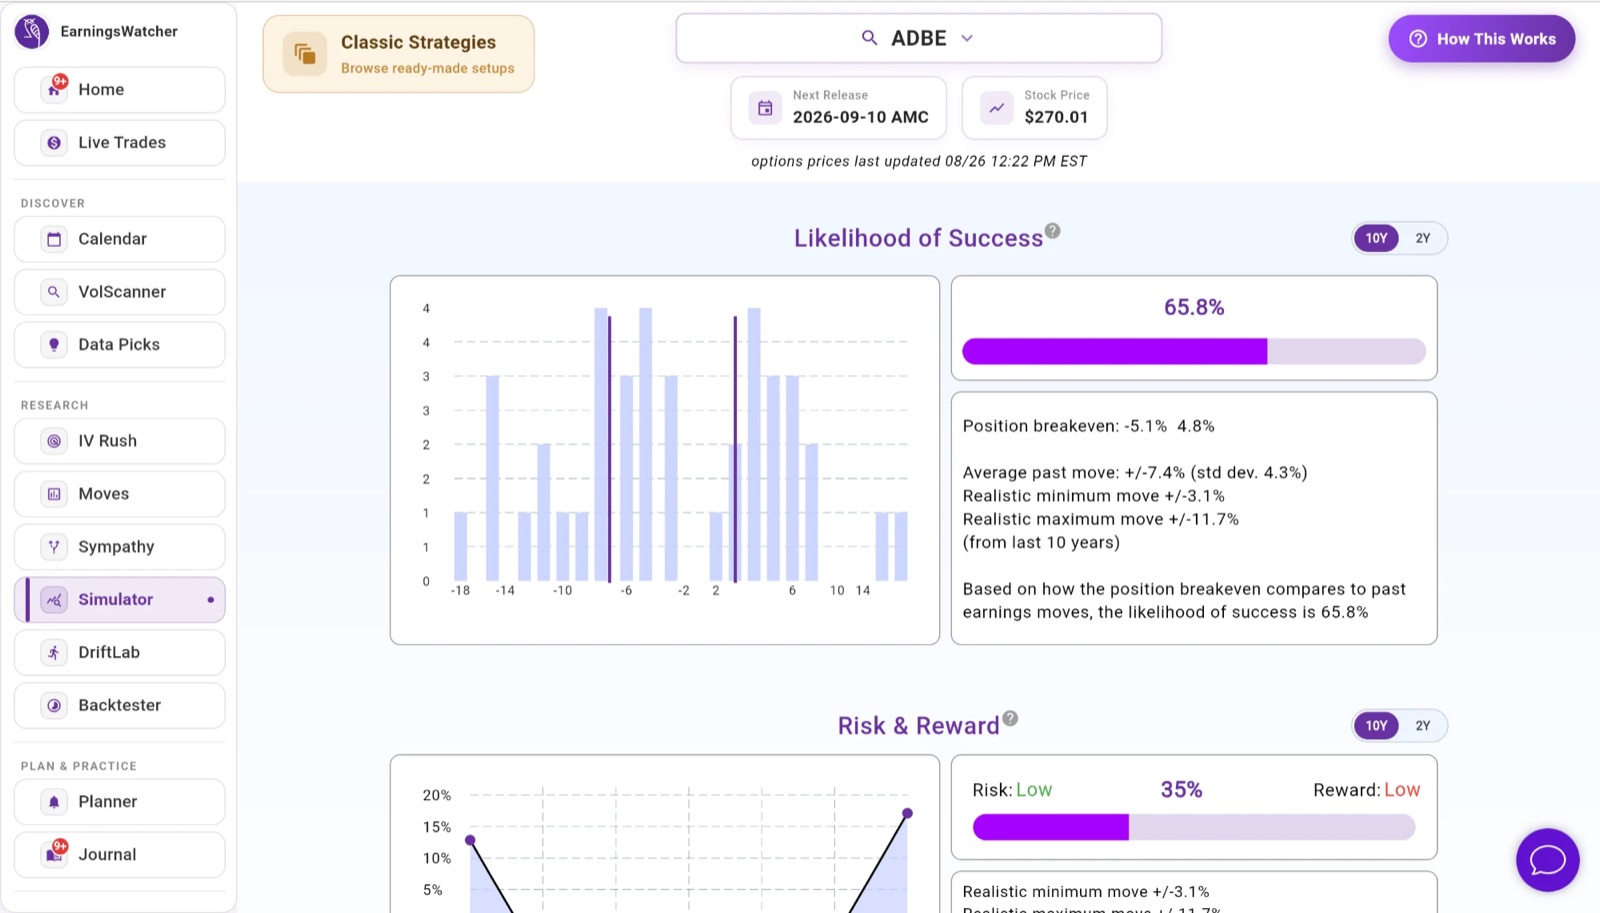
In the Simulator you can put that model to work on any structure: compose any position from the live chain — long or short, any strikes, any expirations — or browse Classic Strategies (straddles and strangles, inverse butterflies, inverse condors) ranked by likelihood of success and risk/reward against ten years of that name's actual earnings moves. Every position is priced through the print with the fitted crush applied leg by leg.

Frequently asked questions
What does an IV crush calculator estimate?
What an option is worth before and after the report. It prices the contract with Black–Scholes at your pre-earnings IV, then reprices it with the post-earnings IV, one day less of time value, and the stock move you enter — so you see crush and direction together rather than one at a time.
Is this EarningsWatcher’s live IV crush tool?
No. This page uses numbers you type in. Live IV rush/crush research is on the platform when you join.
Why do options lose value after earnings even if the stock moves my way?
Because implied volatility often collapses once results are public. If the stock move does not clear what options priced in, that crush can outweigh a modest directional move.
Education only. Not investment advice. No proprietary platform data on this page. Options involve risk.