
Earnings implied moves: week of Nov 16–20, 2026
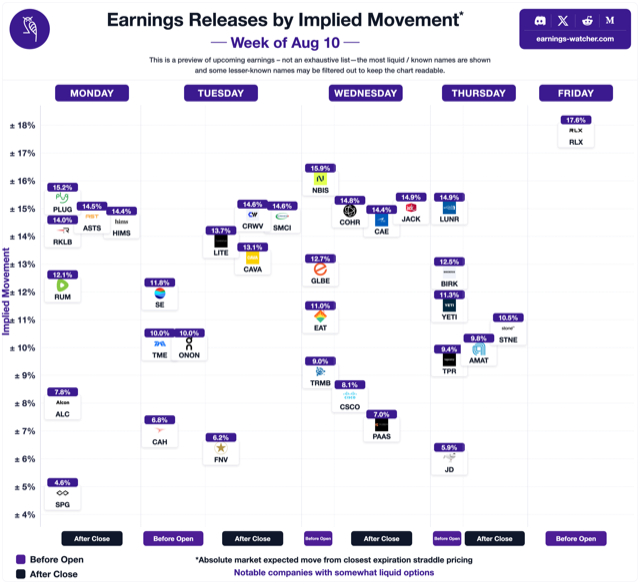
What the options market is pricing in for next week's earnings reports. Biggest implied (expected) moves: LZB ±14.0%, GAP ±12.6%, GLBE ±12.4%, PANW ±12.0%, NVDA ±10.8%. Tables update daily through the week; after Friday this page stays as a dated archive.
Updated November 12, 2026 · interactive calendar · season implied-vs-actual tracker · past weeks: Nov 9, Nov 2, Oct 26, Oct 19, Oct 13, Oct 6, Oct 5, Sep 28, Sep 22, Sep 14, Sep 8, Aug 31, Aug 24, Aug 17, Aug 10, Aug 3, Jul 21
Monday, November 16
| Stock | Session | Implied move | Avg move (10y) | Last move |
|---|---|---|---|---|
| HTHT | BMO | ±9.4% | ±6.7% | +11.6% |
| BIDU | BMO | ±8.1% | ±7.6% | -13.9% |
| TSN | BMO | ±5.9% | ±7.0% | -5.9% |
Implied moves for November 16, one per name
- HTHT (HTHT) options implied move for November 16, 2026 earnings (before market open): ±9.4%. Its average earnings move over the last 10 years is ±6.7%.
- BIDU (Baidu Inc) options implied move for November 16, 2026 earnings (before market open): ±8.1%. Its average earnings move over the last 10 years is ±7.6%.
- TSN (Tyson Foods) options implied move for November 16, 2026 earnings (before market open): ±5.9%. Its average earnings move over the last 10 years is ±7.0%.
Tuesday, November 17
| Stock | Session | Implied move | Avg move (10y) | Last move |
|---|---|---|---|---|
| LZB | AMC | ±14.0% | ±11.8% | +28.1% |
| NVDA | AMC | ±10.8% | ±7.8% | +9.9% |
| AS | BMO | ±10.3% | ±10.1% | +6.5% |
| VIK | BMO | ±9.3% | ±7.7% | -7.8% |
| TME | BMO | ±9.1% | ±8.2% | -17.1% |
| ZTO | AMC | ±8.2% | ±7.7% | -8.3% |
| JD | BMO | ±6.5% | ±8.0% | -8.7% |
| DIS | BMO | ±6.2% | ±6.3% | +5.1% |
| HD | BMO | ±5.2% | ±3.9% | -2.1% |
Implied moves for November 17, one per name
- LZB (La Z Boy Inc) options implied move for November 17, 2026 earnings (after market close): ±14.0%. Its average earnings move over the last 10 years is ±11.8%.
- NVDA (NVIDIA Corporation) options implied move for November 17, 2026 earnings (after market close): ±10.8%. Its average earnings move over the last 10 years is ±7.8%.
- AS (AS) options implied move for November 17, 2026 earnings (before market open): ±10.3%. Its average earnings move over the last 10 years is ±10.1%.
- VIK (Viking Holdings Ltd) options implied move for November 17, 2026 earnings (before market open): ±9.3%. Its average earnings move over the last 10 years is ±7.7%.
- TME (Tencent Music Entertainment Group) options implied move for November 17, 2026 earnings (before market open): ±9.1%. Its average earnings move over the last 10 years is ±8.2%.
- ZTO (ZTO Express (Cayman) Inc) options implied move for November 17, 2026 earnings (after market close): ±8.2%. Its average earnings move over the last 10 years is ±7.7%.
- JD (JD) options implied move for November 17, 2026 earnings (before market open): ±6.5%. Its average earnings move over the last 10 years is ±8.0%.
- DIS (Walt Disney Co) options implied move for November 17, 2026 earnings (before market open): ±6.2%. Its average earnings move over the last 10 years is ±6.3%.
- HD (Home Depot Inc) options implied move for November 17, 2026 earnings (before market open): ±5.2%. Its average earnings move over the last 10 years is ±3.9%.
Wednesday, November 18
| Stock | Session | Implied move | Avg move (10y) | Last move |
|---|---|---|---|---|
| GLBE | BMO | ±12.4% | ±17.8% | +7.7% |
| PANW | AMC | ±12.0% | ±10.5% | -11.2% |
| TGT | BMO | ±9.0% | ±9.8% | +6.2% |
| LOW | BMO | ±5.8% | ±6.0% | +4.7% |
| TJX | BMO | ±5.6% | ±5.5% | -5.9% |
| ZIM | BMO | ±5.3% | ±7.4% | -6.9% |
Implied moves for November 18, one per name
- GLBE (GLBE) options implied move for November 18, 2026 earnings (before market open): ±12.4%. Its average earnings move over the last 10 years is ±17.8%.
- PANW (Palo Alto Networks Inc) options implied move for November 18, 2026 earnings (after market close): ±12.0%. Its average earnings move over the last 10 years is ±10.5%.
- TGT (Target Corp) options implied move for November 18, 2026 earnings (before market open): ±9.0%. Its average earnings move over the last 10 years is ±9.8%.
- LOW (Lowes Companies Inc) options implied move for November 18, 2026 earnings (before market open): ±5.8%. Its average earnings move over the last 10 years is ±6.0%.
- TJX (TJX Companies Inc) options implied move for November 18, 2026 earnings (before market open): ±5.6%. Its average earnings move over the last 10 years is ±5.5%.
- ZIM (ZIM Integrated Shipping Services Ltd) options implied move for November 18, 2026 earnings (before market open): ±5.3%. Its average earnings move over the last 10 years is ±7.4%.
Thursday, November 19
| Stock | Session | Implied move | Avg move (10y) | Last move |
|---|---|---|---|---|
| GAP | AMC | ±12.6% | ±15.4% | +24.1% |
| KEYS | AMC | ±10.6% | ±8.4% | -7.8% |
| INTU | AMC | ±9.5% | ±6.6% | -9.8% |
| BABA | BMO | ±7.4% | ±6.6% | -5.4% |
| ROST | AMC | ±7.4% | ±7.2% | +6.5% |
| NTES | BMO | ±6.6% | ±7.4% | -6.2% |
| WMT | BMO | ±6.3% | ±5.4% | -10.0% |
Implied moves for November 19, one per name
- GAP (GAP) options implied move for November 19, 2026 earnings (after market close): ±12.6%. Its average earnings move over the last 10 years is ±15.4%.
- KEYS (Keysight Technologies Inc) options implied move for November 19, 2026 earnings (after market close): ±10.6%. Its average earnings move over the last 10 years is ±8.4%.
- INTU (Intuit Inc) options implied move for November 19, 2026 earnings (after market close): ±9.5%. Its average earnings move over the last 10 years is ±6.6%.
- BABA (Alibaba Group Holding Ltd) options implied move for November 19, 2026 earnings (before market open): ±7.4%. Its average earnings move over the last 10 years is ±6.6%.
- ROST (Ross Stores Inc) options implied move for November 19, 2026 earnings (after market close): ±7.4%. Its average earnings move over the last 10 years is ±7.2%.
- NTES (NetEase, Inc) options implied move for November 19, 2026 earnings (before market open): ±6.6%. Its average earnings move over the last 10 years is ±7.4%.
- WMT (Walmart Inc) options implied move for November 19, 2026 earnings (before market open): ±6.3%. Its average earnings move over the last 10 years is ±5.4%.
Friday, November 20
| Stock | Session | Implied move | Avg move (10y) | Last move |
|---|---|---|---|---|
| BJ | BMO | ±6.9% | ±9.5% | +6.1% |
Implied moves for November 20, one per name
- BJ (BJs Wholesale Club Holdings Inc) options implied move for November 20, 2026 earnings (before market open): ±6.9%. Its average earnings move over the last 10 years is ±9.5%.
Frequently asked questions
What is an implied move?
The implied move — also called the expected move — is the size of the earnings-day move the options market is pricing in, typically derived from the at-the-money straddle expiring just after the report. It is a magnitude, not a direction.
Which stock has the biggest implied move the week of Nov 16–20, 2026?
As of November 12, 2026, the largest implied moves in next week's preview are LZB ±14.0%, GAP ±12.6%, GLBE ±12.4%, PANW ±12.0%, NVDA ±10.8%.
Do these numbers change?
Yes — implied moves change with option prices, and this page updates daily through its week. After the week ends it is kept as a dated archive.
Research these names properly
Members get the full calendar, live IV rush radar, move history, and the position simulator for every name above.