
Earnings implied moves: week of Oct 13–16, 2026
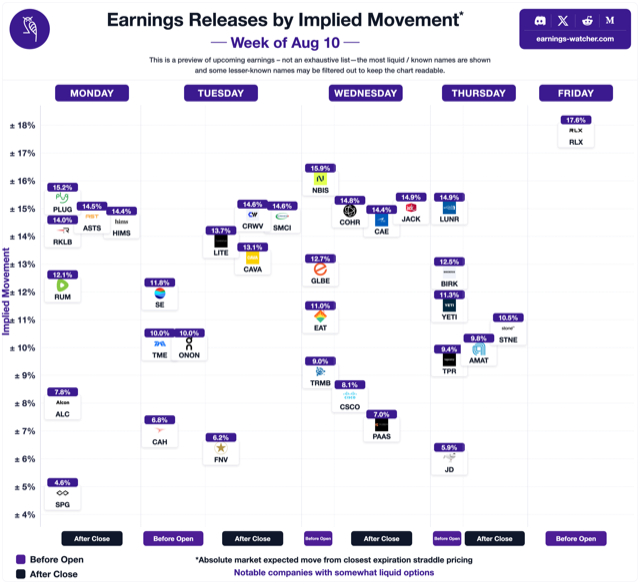
What the options market is pricing in for this week's earnings reports. Biggest implied (expected) moves: ERIC ±14.3%, TFC ±7.7%, CFG ±7.6%, RF ±7.4%, MTB ±7.1%. Tables update daily through the week; after Friday this page stays as a dated archive.
Updated October 15, 2026 · interactive calendar · season implied-vs-actual tracker · past weeks: Oct 6, Oct 5, Sep 28, Sep 22, Sep 14, Sep 8, Aug 31, Aug 24, Aug 17, Aug 10, Aug 3, Jul 21
Tuesday, October 13
| Stock | Session | Implied move | Avg move (10y) | Last move |
|---|---|---|---|---|
| ACI | BMO | ±2.9% | ±6.1% | -24.5% |
| DPZ | BMO | ±2.9% | ±8.0% | +8.6% |
| WFC | BMO | ±2.8% | ±5.1% | -4.4% |
| UNH | BMO | ±2.4% | ±5.9% | +10.3% |
| JPM | BMO | ±2.2% | ±3.4% | +3.0% |
| JNJ | BMO | ±2.2% | ±3.2% | -3.1% |
| GS | BMO | ±2.2% | ±4.2% | +9.4% |
| C | BMO | ±2.2% | ±4.2% | -6.1% |
Implied moves for October 13, one per name
- ACI (Albertsons Companies Inc) options implied move for October 13, 2026 earnings (before market open): ±2.9%. Its average earnings move over the last 10 years is ±6.1%.
- DPZ (Dominos Pizza Inc) options implied move for October 13, 2026 earnings (before market open): ±2.9%. Its average earnings move over the last 10 years is ±8.0%.
- WFC (Wells Fargo and Company) options implied move for October 13, 2026 earnings (before market open): ±2.8%. Its average earnings move over the last 10 years is ±5.1%.
- UNH (UnitedHealth Group Inc) options implied move for October 13, 2026 earnings (before market open): ±2.4%. Its average earnings move over the last 10 years is ±5.9%.
- JPM (JP Morgan Chase and Co) options implied move for October 13, 2026 earnings (before market open): ±2.2%. Its average earnings move over the last 10 years is ±3.4%.
- JNJ (Johnson and Johnson) options implied move for October 13, 2026 earnings (before market open): ±2.2%. Its average earnings move over the last 10 years is ±3.2%.
- GS (Goldman Sachs Group Inc) options implied move for October 13, 2026 earnings (before market open): ±2.2%. Its average earnings move over the last 10 years is ±4.2%.
- C (Citigroup Inc) options implied move for October 13, 2026 earnings (before market open): ±2.2%. Its average earnings move over the last 10 years is ±4.2%.
Wednesday, October 14
| Stock | Session | Implied move | Avg move (10y) | Last move |
|---|---|---|---|---|
| ASML | BMO | ±4.0% | ±5.8% | +3.1% |
| STT | BMO | ±3.0% | ±6.6% | +3.2% |
| FAST | BMO | ±2.5% | ±6.4% | -5.4% |
| BLK | BMO | ±2.5% | ±4.3% | +8.2% |
| MS | BMO | ±2.2% | ±4.6% | -2.8% |
| BAC | BMO | ±2.1% | ±3.9% | +2.9% |
Implied moves for October 14, one per name
- ASML (ASML Holding NV) options implied move for October 14, 2026 earnings (before market open): ±4.0%. Its average earnings move over the last 10 years is ±5.8%.
- STT (State Street Corporation) options implied move for October 14, 2026 earnings (before market open): ±3.0%. Its average earnings move over the last 10 years is ±6.6%.
- FAST (Fastenal Company) options implied move for October 14, 2026 earnings (before market open): ±2.5%. Its average earnings move over the last 10 years is ±6.4%.
- BLK (BlackRock Inc) options implied move for October 14, 2026 earnings (before market open): ±2.5%. Its average earnings move over the last 10 years is ±4.3%.
- MS (Morgan Stanley) options implied move for October 14, 2026 earnings (before market open): ±2.2%. Its average earnings move over the last 10 years is ±4.6%.
- BAC (Bank of America Corporation) options implied move for October 14, 2026 earnings (before market open): ±2.1%. Its average earnings move over the last 10 years is ±3.9%.
Thursday, October 15
| Stock | Session | Implied move | Avg move (10y) | Last move |
|---|---|---|---|---|
| ERIC | BMO | ±14.3% | ±3.3% | -14.1% |
| AA | AMC | ±6.5% | ±8.2% | -6.6% |
| JBHT | AMC | ±6.1% | ±5.5% | +8.5% |
| CMC | BMO | ±5.8% | ±7.4% | +4.4% |
| TSM | BMO | ±5.0% | ±4.9% | -3.8% |
| IBKR | AMC | ±4.7% | ±5.1% | -2.4% |
| SCHW | BMO | ±4.4% | ±4.8% | -2.8% |
| PNC | BMO | ±4.2% | ±3.7% | -1.5% |
| PLD | BMO | ±3.4% | ±3.6% | +4.6% |
| USB | BMO | ±3.2% | ±4.0% | +2.0% |
Implied moves for October 15, one per name
- ERIC (ERIC) options implied move for October 15, 2026 earnings (before market open): ±14.3%. Its average earnings move over the last 10 years is ±3.3%.
- AA (Alcoa Corporation) options implied move for October 15, 2026 earnings (after market close): ±6.5%. Its average earnings move over the last 10 years is ±8.2%.
- JBHT (J B Hunt Transport Services Inc) options implied move for October 15, 2026 earnings (after market close): ±6.1%. Its average earnings move over the last 10 years is ±5.5%.
- CMC (Commercial Metals Company) options implied move for October 15, 2026 earnings (before market open): ±5.8%. Its average earnings move over the last 10 years is ±7.4%.
- TSM (Taiwan Semiconductor Manufacturing Co Ltd) options implied move for October 15, 2026 earnings (before market open): ±5.0%. Its average earnings move over the last 10 years is ±4.9%.
- IBKR (Interactive Brokers Group Inc) options implied move for October 15, 2026 earnings (after market close): ±4.7%. Its average earnings move over the last 10 years is ±5.1%.
- SCHW (Charles Schwab Corporation) options implied move for October 15, 2026 earnings (before market open): ±4.4%. Its average earnings move over the last 10 years is ±4.8%.
- PNC (PNC Financial Services Group Inc) options implied move for October 15, 2026 earnings (before market open): ±4.2%. Its average earnings move over the last 10 years is ±3.7%.
- PLD (Prologis) options implied move for October 15, 2026 earnings (before market open): ±3.4%. Its average earnings move over the last 10 years is ±3.6%.
- USB (US Bancorp) options implied move for October 15, 2026 earnings (before market open): ±3.2%. Its average earnings move over the last 10 years is ±4.0%.
Friday, October 16
| Stock | Session | Implied move | Avg move (10y) | Last move |
|---|---|---|---|---|
| TFC | BMO | ±7.7% | ±4.1% | +1.8% |
| CFG | BMO | ±7.6% | ±4.6% | +5.0% |
| RF | BMO | ±7.4% | ±4.1% | -2.9% |
| MTB | BMO | ±7.1% | ±4.7% | +2.8% |
| TRV | BMO | ±6.3% | ±4.8% | +9.7% |
Implied moves for October 16, one per name
- TFC (Truist Financial Corporation) options implied move for October 16, 2026 earnings (before market open): ±7.7%. Its average earnings move over the last 10 years is ±4.1%.
- CFG (Citizens Financial Group Inc) options implied move for October 16, 2026 earnings (before market open): ±7.6%. Its average earnings move over the last 10 years is ±4.6%.
- RF (Regions Financial Corporation) options implied move for October 16, 2026 earnings (before market open): ±7.4%. Its average earnings move over the last 10 years is ±4.1%.
- MTB (M&T Bank Corporation) options implied move for October 16, 2026 earnings (before market open): ±7.1%. Its average earnings move over the last 10 years is ±4.7%.
- TRV (The Travelers Companies Inc) options implied move for October 16, 2026 earnings (before market open): ±6.3%. Its average earnings move over the last 10 years is ±4.8%.
Frequently asked questions
What is an implied move?
The implied move — also called the expected move — is the size of the earnings-day move the options market is pricing in, typically derived from the at-the-money straddle expiring just after the report. It is a magnitude, not a direction.
Which stock has the biggest implied move the week of Oct 13–16, 2026?
As of October 15, 2026, the largest implied moves in this week's preview are ERIC ±14.3%, TFC ±7.7%, CFG ±7.6%, RF ±7.4%, MTB ±7.1%.
Do these numbers change?
Yes — implied moves change with option prices, and this page updates daily through its week. After the week ends it is kept as a dated archive.
Research these names properly
Members get the full calendar, live IV rush radar, move history, and the position simulator for every name above.