
Earnings implied moves: week of Nov 9–13, 2026
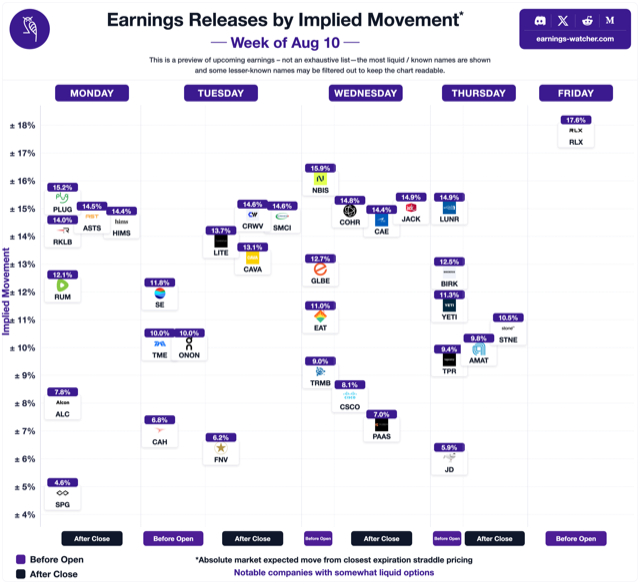
What the options market is pricing in for next week's earnings reports. Biggest implied (expected) moves: LCID ±21.5%, CRWV ±21.2%, ASTS ±19.2%, MRCY ±16.7%, WIX ±16.1%. Tables update daily through the week; after Friday this page stays as a dated archive.
Updated November 6, 2026 · interactive calendar · season implied-vs-actual tracker · past weeks: Nov 2, Oct 26, Oct 19, Oct 13, Oct 6, Oct 5, Sep 28, Sep 22, Sep 14, Sep 8, Aug 31, Aug 24, Aug 17, Aug 10, Aug 3, Jul 21
Monday, November 9
| Stock | Session | Implied move | Avg move (10y) | Last move |
|---|---|---|---|---|
| LCID | AMC | ±21.5% | ±13.0% | -20.6% |
| ASTS | AMC | ±19.2% | ±20.6% | +4.6% |
| HIMS | AMC | ±16.1% | ±16.0% | -7.4% |
| TTD | AMC | ±15.4% | ±18.1% | -27.4% |
| RKLB | AMC | ±15.4% | ±14.6% | -5.7% |
| ZETA | AMC | ±15.4% | ±14.4% | +17.5% |
| PLUG | AMC | ±14.9% | ±12.3% | +20.1% |
| ACHR | AMC | ±14.0% | ±13.3% | +13.1% |
| TTWO | AMC | ±9.1% | ±8.6% | +6.5% |
| BAP | AMC | ±8.3% | ±4.7% | +4.5% |
| CEG | BMO | ±8.0% | ±7.0% | +5.6% |
| FERG | BMO | ±8.0% | ±6.5% | +4.3% |
| KKR | BMO | ±5.8% | ±5.1% | -3.6% |
| OXY | AMC | ±5.5% | ±5.6% | +6.6% |
Implied moves for November 9, one per name
- LCID (Lucid Group Inc) options implied move for November 9, 2026 earnings (after market close): ±21.5%. Its average earnings move over the last 10 years is ±13.0%.
- ASTS (AST SpaceMobile Inc) options implied move for November 9, 2026 earnings (after market close): ±19.2%. Its average earnings move over the last 10 years is ±20.6%.
- HIMS (Hims and Hers Health Inc) options implied move for November 9, 2026 earnings (after market close): ±16.1%. Its average earnings move over the last 10 years is ±16.0%.
- TTD (The Trade Desk Inc) options implied move for November 9, 2026 earnings (after market close): ±15.4%. Its average earnings move over the last 10 years is ±18.1%.
- RKLB (Rocket Lab USA, Inc) options implied move for November 9, 2026 earnings (after market close): ±15.4%. Its average earnings move over the last 10 years is ±14.6%.
- ZETA (Zeta Global Holdings Corp) options implied move for November 9, 2026 earnings (after market close): ±15.4%. Its average earnings move over the last 10 years is ±14.4%.
- PLUG (Plug Power Inc) options implied move for November 9, 2026 earnings (after market close): ±14.9%. Its average earnings move over the last 10 years is ±12.3%.
- ACHR (Archer Aviation Inc) options implied move for November 9, 2026 earnings (after market close): ±14.0%. Its average earnings move over the last 10 years is ±13.3%.
- TTWO (TakeTwo Interactive Software Inc) options implied move for November 9, 2026 earnings (after market close): ±9.1%. Its average earnings move over the last 10 years is ±8.6%.
- BAP (Credicorp Ltd) options implied move for November 9, 2026 earnings (after market close): ±8.3%. Its average earnings move over the last 10 years is ±4.7%.
- CEG (Constellation Energy Corporation generates and sells electricity in the United States) options implied move for November 9, 2026 earnings (before market open): ±8.0%. Its average earnings move over the last 10 years is ±7.0%.
- FERG (Ferguson Plc) options implied move for November 9, 2026 earnings (before market open): ±8.0%. Its average earnings move over the last 10 years is ±6.5%.
- KKR (KKR and Company Inc) options implied move for November 9, 2026 earnings (before market open): ±5.8%. Its average earnings move over the last 10 years is ±5.1%.
- OXY (Occidental Petroleum Corporation) options implied move for November 9, 2026 earnings (after market close): ±5.5%. Its average earnings move over the last 10 years is ±5.6%.
Tuesday, November 10
| Stock | Session | Implied move | Avg move (10y) | Last move |
|---|---|---|---|---|
| CRWV | AMC | ±21.2% | ±17.9% | +23.8% |
| MRCY | AMC | ±16.7% | ±13.9% | -7.2% |
| WIX | BMO | ±16.1% | ±13.6% | +20.2% |
| HSAI | BMO | ±15.4% | ±21.2% | -13.1% |
| SE | BMO | ±14.0% | ±15.7% | +14.9% |
| RGTI | AMC | ±13.0% | ±14.9% | +8.6% |
| ONON | BMO | ±12.8% | ±15.8% | -22.4% |
| ALC | AMC | ±7.9% | ±5.9% | +3.5% |
| EC | AMC | ±6.1% | ±3.1% | -3.3% |
| PBR | AMC | ±5.9% | ±5.2% | -3.2% |
Implied moves for November 10, one per name
- CRWV (CoreWeave) options implied move for November 10, 2026 earnings (after market close): ±21.2%. Its average earnings move over the last 10 years is ±17.9%.
- MRCY (Mercury Systems Inc) options implied move for November 10, 2026 earnings (after market close): ±16.7%. Its average earnings move over the last 10 years is ±13.9%.
- WIX (Wix com Ltd) options implied move for November 10, 2026 earnings (before market open): ±16.1%. Its average earnings move over the last 10 years is ±13.6%.
- HSAI (HSAI) options implied move for November 10, 2026 earnings (before market open): ±15.4%. Its average earnings move over the last 10 years is ±21.2%.
- SE (Sea Ltd) options implied move for November 10, 2026 earnings (before market open): ±14.0%. Its average earnings move over the last 10 years is ±15.7%.
- RGTI (RGTI) options implied move for November 10, 2026 earnings (after market close): ±13.0%. Its average earnings move over the last 10 years is ±14.9%.
- ONON (On Holding) options implied move for November 10, 2026 earnings (before market open): ±12.8%. Its average earnings move over the last 10 years is ±15.8%.
- ALC (Alcon Inc) options implied move for November 10, 2026 earnings (after market close): ±7.9%. Its average earnings move over the last 10 years is ±5.9%.
- EC (Ecopetrol) options implied move for November 10, 2026 earnings (after market close): ±6.1%. Its average earnings move over the last 10 years is ±3.1%.
- PBR (PBR) options implied move for November 10, 2026 earnings (after market close): ±5.9%. Its average earnings move over the last 10 years is ±5.2%.
Wednesday, November 11
| Stock | Session | Implied move | Avg move (10y) | Last move |
|---|---|---|---|---|
| CAE | AMC | ±16.1% | ±7.9% | -5.7% |
| RUM | BMO | ±14.7% | ±12.8% | +13.2% |
| CTVA | AMC | ±12.3% | ±6.7% | -11.9% |
| FNV | AMC | ±6.8% | ±3.7% | -3.5% |
Implied moves for November 11, one per name
- CAE (Cae Inc) options implied move for November 11, 2026 earnings (after market close): ±16.1%. Its average earnings move over the last 10 years is ±7.9%.
- RUM (Rumble Inc) options implied move for November 11, 2026 earnings (before market open): ±14.7%. Its average earnings move over the last 10 years is ±12.8%.
- CTVA (Corteva Inc) options implied move for November 11, 2026 earnings (after market close): ±12.3%. Its average earnings move over the last 10 years is ±6.7%.
- FNV (Franco Nevada Corp) options implied move for November 11, 2026 earnings (after market close): ±6.8%. Its average earnings move over the last 10 years is ±3.7%.
Thursday, November 12
| Stock | Session | Implied move | Avg move (10y) | Last move |
|---|---|---|---|---|
| DLO | AMC | ±13.1% | ±21.6% | -5.2% |
| YETI | BMO | ±11.2% | ±12.6% | -13.8% |
| STNE | AMC | ±10.8% | ±15.3% | -8.3% |
| AMAT | AMC | ±10.4% | ±6.5% | -7.0% |
Implied moves for November 12, one per name
- DLO (dLocal) options implied move for November 12, 2026 earnings (after market close): ±13.1%. Its average earnings move over the last 10 years is ±21.6%.
- YETI (YETI Holdings Inc) options implied move for November 12, 2026 earnings (before market open): ±11.2%. Its average earnings move over the last 10 years is ±12.6%.
- STNE (StoneCo Ltd) options implied move for November 12, 2026 earnings (after market close): ±10.8%. Its average earnings move over the last 10 years is ±15.3%.
- AMAT (Applied Materials Inc) options implied move for November 12, 2026 earnings (after market close): ±10.4%. Its average earnings move over the last 10 years is ±6.5%.
Frequently asked questions
What is an implied move?
The implied move — also called the expected move — is the size of the earnings-day move the options market is pricing in, typically derived from the at-the-money straddle expiring just after the report. It is a magnitude, not a direction.
Which stock has the biggest implied move the week of Nov 9–13, 2026?
As of November 6, 2026, the largest implied moves in next week's preview are LCID ±21.5%, CRWV ±21.2%, ASTS ±19.2%, MRCY ±16.7%, WIX ±16.1%.
Do these numbers change?
Yes — implied moves change with option prices, and this page updates daily through its week. After the week ends it is kept as a dated archive.
Research these names properly
Members get the full calendar, live IV rush radar, move history, and the position simulator for every name above.