
- Global-E Online (GLBE) closed higher on earnings day in 5 of its last 17 reports (29%) and lower in 12.
- GLBE's average close-to-close earnings-day move over those 17 reports is ±12.0%; the intraday peak faded into the close 29% of the time.
- GLBE's worst earnings-day close in the tracked period was -27.1% (Nov 15, 2023) and its best +24.4% (Aug 16, 2022).
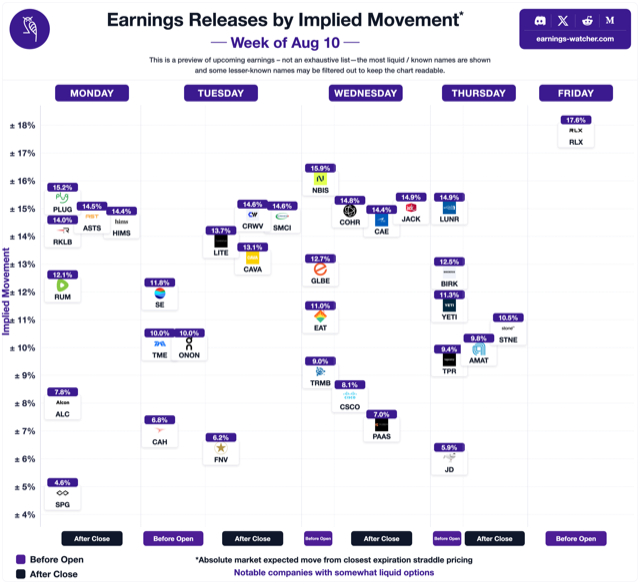
- On its most recent report (Aug 12, 2026) GLBE options had priced ±13.7%; the stock closed -0.8% with a peak of +7.7%.
GLBE's last five earnings reactions
| Report | Options priced | Close move | Peak move | Held or faded? |
|---|---|---|---|---|
| Aug 12, 2026 | ±13.7% | -0.8% | +7.7% | faded |
| May 13, 2026 | ±14.6% | -8.9% | -11.2% | held |
| Feb 18, 2026 | ±14.5% | +17.2% | +23.5% | held |
| Nov 19, 2025 | ±16.2% | -4.4% | -9.4% | faded |
| Aug 13, 2025 | ±15.6% | -8.6% | -11.7% | held |
"Options priced" is the implied move going into the report; "close" and "peak" are the earnings-day close-to-close and peak intraday moves. "Faded" = the close gave back more than half of the peak, or reversed sign. Full implied-vs-actual history and the live implied move: GLBE data page.
What post-earnings drift is
The reaction day settles the gap; it does not settle the story. Over the following days and weeks a stock can follow through — keep moving in the direction of its earnings reaction (the effect academics call post-earnings announcement drift, PEAD) — or it can fill the gap and drift back toward where it closed before the report, or simply hold. Which of those a given stock tends to do is measurable from its own history, and that is exactly what DriftLab measures: for every past release it tracks the closes at +3, +7, +15, +30 and +60 sessions against the pre-earnings close, labels the drift, and rolls the record into three scores — Follow-Through, Gap-Fill probability and PEAD.
What GLBE did in the weeks after each report
The earnings-day close is only the start. DriftLab follows every Global-E Online release out to sixty sessions, measured off the last close before the print — here are the two most recent, exactly as members see them; in 5 of the last 15 reports the stock was further in the direction of its earnings-day close thirty sessions later.
| Report | Reaction close | +3d | +7d | +15d | +30d | +60d | Drift |
|---|---|---|---|---|---|---|---|
| Aug 12, 2026 | -0.8% | +0.8% | -0.8% | -5.0% | +0.0% | +6.0% | mild |
| May 13, 2026 | -8.9% | -4.5% | -0.9% | +8.8% | +20.4% | +36.1% | low |
| Feb 18, 2026 | ▮▮.▮% | ▮▮.▮% | ▮▮.▮% | ▮▮.▮% | ▮▮.▮% | ▮▮.▮% | ▮▮▮ |
| Nov 19, 2025 | ▮▮.▮% | ▮▮.▮% | ▮▮.▮% | ▮▮.▮% | ▮▮.▮% | ▮▮.▮% | ▮▮▮ |
| Aug 13, 2025 | ▮▮.▮% | ▮▮.▮% | ▮▮.▮% | ▮▮.▮% | ▮▮.▮% | ▮▮.▮% | ▮▮▮ |
Why "good earnings" can still mean a red day
Before the report, options price the size of the expected move — the implied move — and the stock itself is priced for the market's expectations of results and guidance. The reaction is not to the numbers in isolation but to how they compare with what was already priced. That is why GLBE can beat estimates and fall, or miss and rise; and why the honest question is not "were the numbers good?" but "how far did the stock move against what options priced, and did it hold?" — which is what the season tracker follows for every notable name.
Frequently asked questions
Will GLBE stock go up after earnings?
Nobody can know in advance. What history says: over 17 tracked reports Global-E Online closed higher on earnings day 5 times and lower 12 times, with an average close move of ±12.0%. The options market prices the expected size of the move, not its direction.
Why does GLBE stock drop (or jump) after earnings even on good numbers?
Because the stock is priced for expectations, not results. Options price a move of a certain size beforehand; the reaction reflects how results and guidance compare with what was already priced in, plus the unwinding of positioning around the event. A beat can still be a disappointment relative to expectations.
Does GLBE's earnings move usually hold or fade?
In 5 of 17 tracked reports the earnings-day peak faded meaningfully into the close. Whether the move continues over the following days is what EarningsWatcher's DriftLab measures for members (follow-through, gap-fill probability, post-earnings drift).
How much does GLBE usually move on earnings?
On average about ±17.8% at the peak of earnings day over the last 10 years, with an average close-to-close move of ±12.0% across the tracked reports on this page.